This week’s snapshot: 10-Year Treasury at 4.45%. 30-year fixed mortgage at 6.49%. The spread between them is 2.04% (204 basis points). For context, the historical average spread is around 1.70%. We are still running well above that — and that matters for your monthly payment.
10-Year Treasury Yield — Last 6 Months
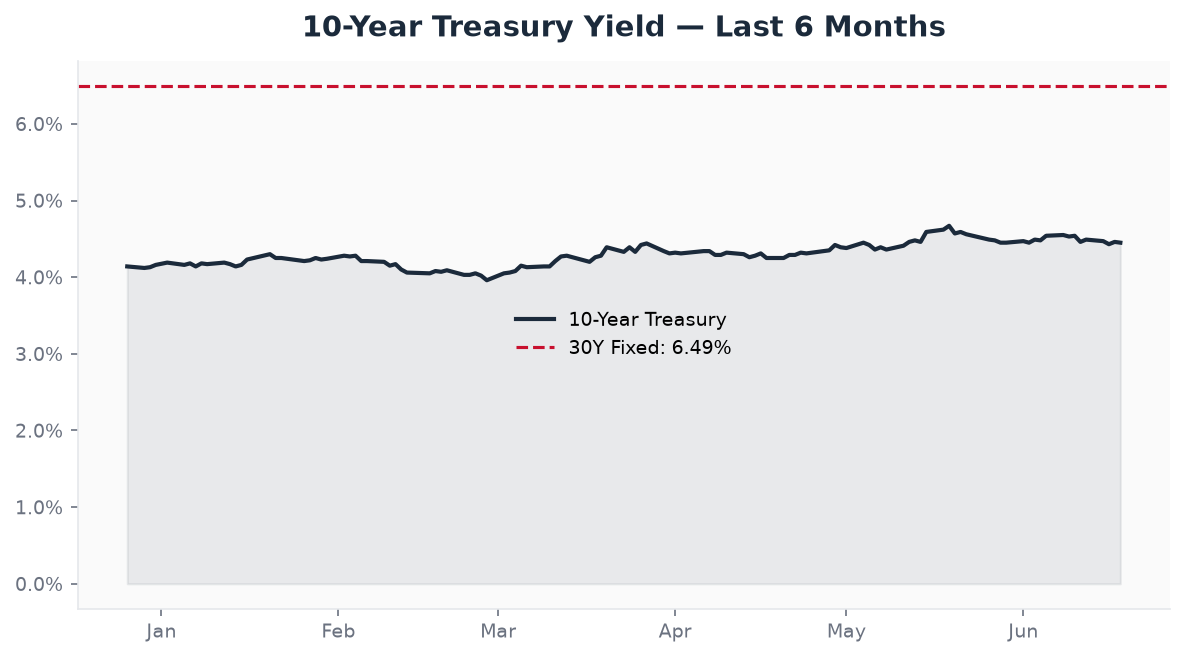
The 10-Year is sitting at 4.45% right now, which is basically the middle of the range we have been trading in for the last few months. We hit a high around 4.67% back in mid-May, and we have been slowly drifting lower since then — down about 22 basis points over the last month. That is a meaningful move in the right direction, but we are still a long way from the 3.70s we saw back in early February. The driver? A mix of inflation that won’t quit (more on that below) and uncertainty about what the Fed does next. The trend over the last few weeks is slightly down, which is encouraging, but it’s a slow grind.
Mortgage Spread: The Hidden Cost
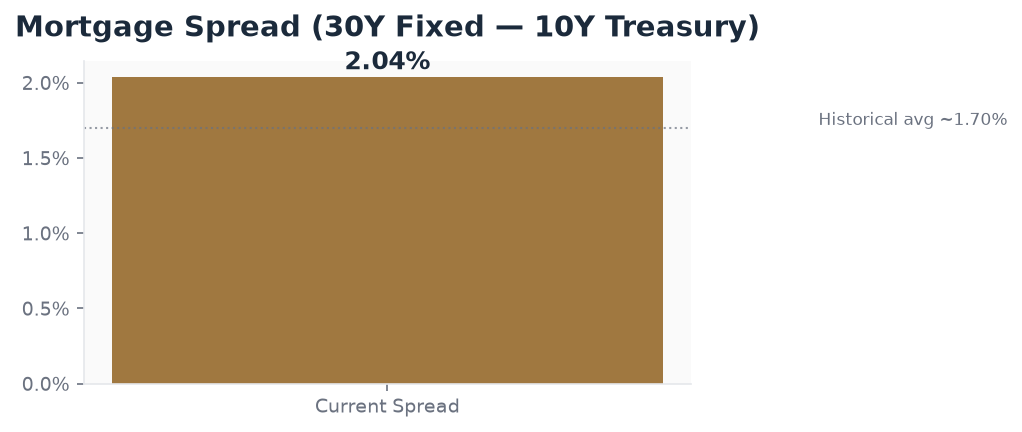
Here is the part most people miss. The spread between the 10-Year Treasury and the 30-year fixed mortgage rate is sitting at 2.04%. Historically, that spread has been closer to 1.70%. That extra 0.34% — 34 basis points — is what lenders are charging on top of normal market conditions to account for prepayment risk, servicing costs, and general uncertainty. On a $400,000 loan, that extra spread costs you roughly $80 more per month. There is no sign of meaningful compression yet. Until the spread tightens back toward historical norms, mortgage rates are going to stay higher than the 10-Year alone would suggest. That is the hidden tax borrowers are paying right now.
Fed Watch: What Markets Are Pricing In
The Fed just wrapped up their June 16-17 meeting and held rates steady at 3.50%-3.75% — the fourth consecutive hold. The next FOMC meeting is July 28-29. Right now, the CME FedWatch tool shows essentially zero chance of a rate cut. In fact, markets are pricing in about a 34% probability of a rate hike between now and the end of the year, with the rest on hold. The latest inflation numbers don’t help. May CPI came in at 4.2% year-over-year — still well above the Fed’s 2% target. And May PPI hit 6.5% year-over-year, which tells us producer costs are still rising fast. Until we see real progress on inflation, the Fed is likely to stay put — or even hike again if things get worse. No rate cuts means no immediate relief for mortgage rates from that direction.
What This Means for Twin Cities Home Buyers
Here is where the rubber meets the road. Mortgage rates at 6.49% mean the typical Twin Cities buyer can afford about $40,000-$50,000 less house than they could at 6% — and about $100,000 less than at the sub-3% rates of 2021. That is real money, and it is squeezing buyers at every price point.
The Twin Cities spring market has been active — as it always is — but the higher rates are shifting where buyers can compete. Entry-level homes under $350,000 are still seeing multiple offers because that’s where the demand is. Move-up homes in the $500k-$700k range are sitting a little longer. And anything over a million is moving slowly unless it is priced perfectly. The spread matters here too. Even if the 10-Year drifts down to 4.0%, we probably are not seeing 5.5% mortgages until the spread normalizes. That is just the reality of the current lending environment.
If you are in the market right now, the playbook is simple. Get pre-approved before you look at a single house. Know exactly what rate you qualify for and what your payment looks like. Do not stretch yourself thin hoping rates drop next year — buy what you can afford today. If rates come down later, you can refinance. You cannot refinance your way out of overpaying for a house you bought at the top of your budget.
Looking Ahead
The next big data points are the June CPI report on July 14 and PPI on July 15, followed by the FOMC meeting July 28-29. If inflation surprises to the downside, we might see the 10-Year drift lower and mortgage rates follow. If inflation stays hot — especially with PPI running at 6.5% — the hike talk gets louder and rates could go up. Either way, the Twin Cities market is still moving. Summer inventory is coming, and well-priced homes in good condition are still selling. The difference is how much house your money buys, and that depends on rates. Let’s talk about your specific situation.
Data sources: Federal Reserve (FRED), Freddie Mac PMMS, CME FedWatch. This is not financial advice — talk to your lender. I’m a Realtor, not a mortgage broker. But I watch these numbers every week because they tell me what my clients can actually afford.
Ready to Make Your Move?
Whether buying, selling, or watching — I’ll tell you straight what these numbers mean for your situation. Call or text: 952-994-4451 or use the form below. No pressure, no pitch. Just honest answers.